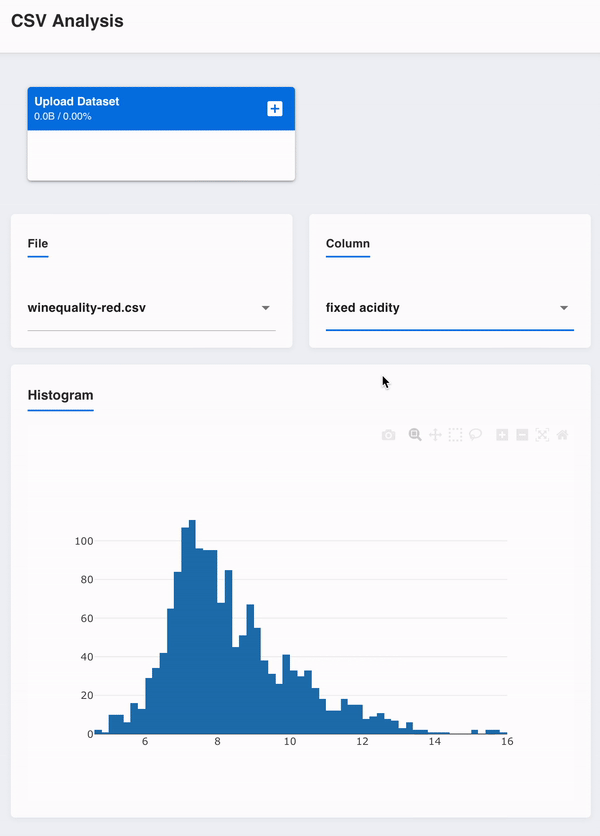
In this tutorial, we'll learn to build a simple app for exploratory data analysis. The app will let us upload CSV files and visualize the data distribution in a histogram, and we'll interact through selectors to choose the CSV file and column to be plotted. Take a look at the final app:
The full code and some sample CSV files can be downloaded from this GitHub repository.
Setup and app structure
We'll use GenieFramework.jl, DataFrames.jl and CSV.jl to build the
app. To install them, use the builtin package manager, or launch a REPL and enter Pkg mode with ] and type in the following
command:
pkg> add GenieFramework DataFrames CSVThe app's code will have a main file app.jl for the logic,
ui.jl for the UI, and an uploads folder to store the datasets:
CSVAnalysis
├── app.jl
├── ui.jl
└── uploads/We will not use the app.jl.html that is created by default.
Implementation
Let's start by opening the app.jl file and adding the
following skeleton code:
using GenieFramework, DataFrames, CSV
@genietools

#
# Logic goes here
#

@page("/", "ui.jl")
Server.isrunning() || Server.up()The @genietools macro sets up the Genie environment and the @page
macro renders the app's UI, whereas the logic will be implemented in
between. For the ui.jl file this will be the skeleton code:
[
    #
    # UI definition goes here
    #
] |> stringThe app has four components: an upload box, two selectors, and a histogram plot. To implement each component, we'll need to:
- Define the necessary variables and expose them to the UI.
- Implement component's behavior.
- Define component's UI in
ui.jl.
Upload box
The upload box lets us select a .csv file and store it on the server
side. The file is transmitted via an HTTP POST request, with the file
attached in the header. To enable this request, add the following
configuration lines to app.jl:
Genie.config.cors_headers["Access-Control-Allow-Origin"]  =  "*"
Genie.config.cors_headers["Access-Control-Allow-Headers"] = "Content-Type"
Genie.config.cors_headers["Access-Control-Allow-Methods"] = "GET,POST,PUT,DELETE,OPTIONS"
Genie.config.cors_allowed_origins = ["*"]Next, we'll create the storage folder if it doesn't already exist, and give our app page a title.
const FILE_PATH = "upload"
mkpath(FILE_PATH)
@out title = "CSV Analysis"The @out macro makes it so the code in the UI can access the value of
a variable. Before adding more logic, let us proceed with the UI.
The UI is structured via Julia functions that implement various HTML and
Javascript components. To add the page title and upload box, write in
ui.jl the following:
[
    heading("{{title}}")
    row([
        cell(class="col-md-12", [
            uploader(label="Upload Dataset", accpt=".csv", multiple=true, method="POST", url="http://localhost:8000/", field__name="csv_file")
        ])
    ])
] |> string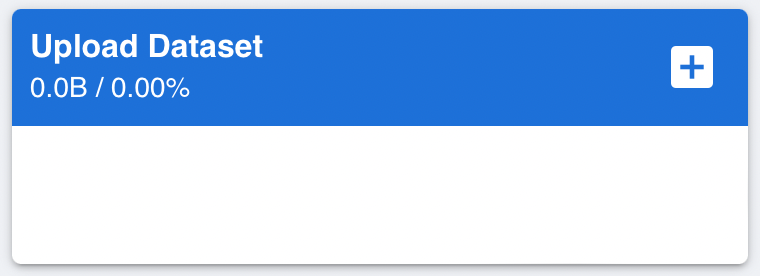
While heading, row and cell simply generate the HTML code for
headers and dividers, the uploader function generates the Javascript
allowing us to pick and upload a file. The url argument points to the
address where the POST request will be submitted, and so we'll require
a route on the server that handles the request. For this, add the
following code to app.jl:
route("/", method = POST) do
  files = Genie.Requests.filespayload()
  for f in files
      write(joinpath(FILE_PATH, f[2].name), f[2].data)
  end
  if length(files) == 0
      @info "No file uploaded"
  end
  return "Upload finished"
endThe route function sets up a listener function at a path that will be
executed for incoming requests. Instead of defining a standalone
function that stores the file in the request header, we've used Julia's
do end syntax which builds an anonymous function with the code in the
block and passes it to route.
The upload box is now finished and working. Give it a try by launching a preview in a new browser tab.
File and column selectors
Once we have the .csv file uploaded, we want to access its contents and choose one column for plotting. We'll do the choosing through two selectors, which rely on several variables to store:
- The selected file, and the list of uploaded files.
- The selected column in a file, and the list of columns in the file.
Let's add to app.jl the variables with default values as
@in selected_file = "iris.csv"
@in selected_column = "petal.length"
@out upfiles = readdir(FILE_PATH)
@out columns = ["petal.length", "petal.width", "sepal.length", "sepal.width", "variety"]Note that we tag the selection variables with @in as they'll be
storing values sent from the UI.
Now, we define the UI with
row([
cell(class="st-module", [
  h6("File")
  Stipple.select(:selected_file; options=:upfiles)
])
cell(class="st-module", [
  h6("Column")
  Stipple.select(:selected_column; options=:columns)
])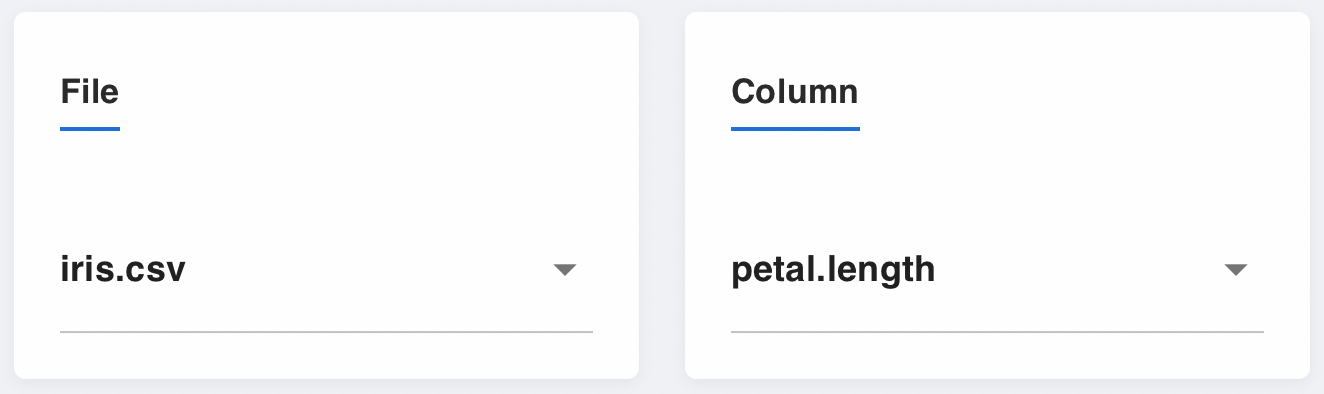
The selectors are generated by Stipple.select, which takes as first
argument the symbol name of the variable where the selected value will
be stored.
As of now, when the user makes a selection the chosen values are stored in the corresponding variables. All we need to do now is use these values to generate the histogram plot.
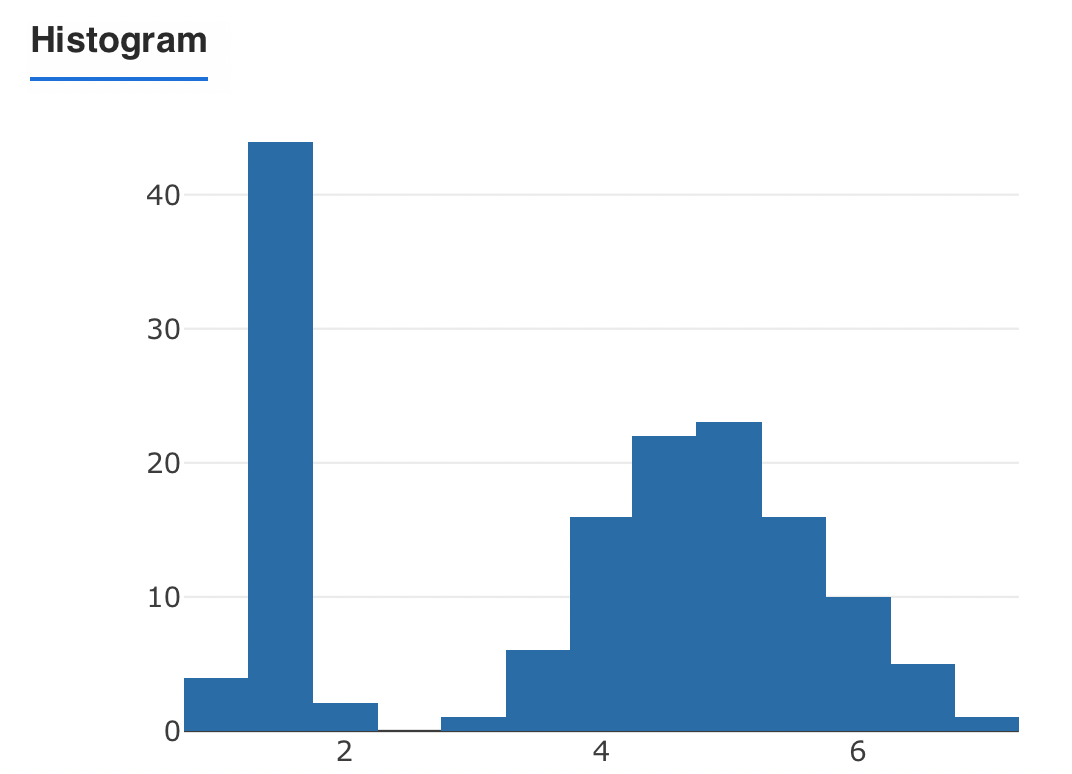
Histogram
Since all the interactive elements are already implemented, we'll add to
app.jl the reactive code that
- Loads the CSV file into a DataFrame.
- Refreshes the column selector choices with the column names of the selected file.
- Plots the histogram of the selected column.
For the plotting, we'll use a PlotData struct that can be
parameterized to different plot types such as scatter plots or
histograms. We'll define the variable storing the plot as
@out irisplot = PlotData()In Genie, reactive code is implemented within a handler defined with the
@handlers macro. In it, we use the @onchangeany macro to act
whenever a variable changes in the UI as follows:
@handlers begin
    @onchangeany isready, selected_file, selected_column begin
        upfiles = readdir(FILE_PATH)
        data = CSV.read(joinpath(FILE_PATH, selected_file), DataFrame)
        columns = names(data)
        if selected_column in names(data)
            irisplot = PlotData(x=data[!, selected_column], plot=StipplePlotly.Charts.PLOT_TYPE_HISTOGRAM)
        end
    end
endNotice the isready variable, which is provided by Genie to indicate
when the browser has finished loading the UI. Finally, the code for the
UI element to display the plot is
  row([
    cell(class="st-module", [
      h5("Histogram")
      plot(:irisplot)
    ])
 ])
That's it, we're done! Now you can run the full app and add some more functionality if you'd like. Here are some ideas:
- Add a scatter plot.
- Add other interactive elements such as sliders to change the parameters of the plot.
- Add the clustering algorithm from the Iris tutorial and try it on different datasets.